Theobroma cacao is mainly cultivated by small growers, especially in the main production area in West Africa. The sustainability of cocoa cultivation will be improved if farmers have access to new planting material with improved agronomic traits such as yield, vigour, pest, and disease resistance. Progress in breeding programmes to accumulate favourable alleles for these traits can be accelerated using molecular marker techniques which allow more direct access to the genome. The technology has developed rapidly and over the last ten years studies have been carried out to map QTLs for agronomic traits in several plant species. In cocoa, a number of progenies have been mapped and several QTL related to resistance to Phytophthora spp. and to yield components have been detected. The comparison of the different linkage maps of cocoa is possible through specific markers (RFLP and microsatellites) mapped on to a reference map containing 473 markers. The purpose of this paper is to analyse available results on the detection of QTL for yield and vigour traits and the co-location of the QTL identified in different parental genotypes. Methodological approaches to the detection of QTL are also presented. Perspectives for further research on mapping of yield and vigour traits and the possible use of molecular markers in the selection for these traits in cocoa are discussed.
Introduction
Most cocoa is produced by small holders who cultivate the trees in addition to food crops for family consumption. The income they gain from cocoa is often saved to support them in later life. Africa supplies nearly 70% of the world’s production of cocoa with Côte dIvoire as the principal producer. Improved planting material, better adapted to the local environment, and disease conditions, can be produced through breeding programmes designed to accumulate favourable alleles for the main agronomic traits. In cocoa. the selection cycle normally requires 6 to 8 years of observations. Therefore the development of effective early screening methods to accelerate progress is of great interest. Cocoa breeders are also investigating the use of successive cycles of selection, for example a recurrent selection program has been initiated in Côte d’lvoire to improve lower Amazon Forastero and upper Amazon Forastero populations by successive cycles of selection inside each population (Clement et. al.1994; Eskes et.al. 1995)
Recent progress in molecular marker technology now allows more direct access to the genotype and the use of molecular markers in the genetic mapping of the main agronomic traits has been considerably developed in recent years. A new field of research in cocoa breeding has opened. The first cocoa linkage map was presented by Lanaud et al. (1995) from a progeny resulting from the Côte d’lvoire cocoa breeding programme and a high density linkage map was estabhshed recently by Risterucci et a!. (2000). Genetic mapping of agronomic traits (disease resistance and yield components) was carried out with this reference progeny by Lanaud eta!. (1999) and with other progenies by Flament et al. (2000), by Crouzillat eta!. (1996, 2000) and by clement et a. (2000).
In the present paper we report the main results of studies to detect QTL related to yield components, to attack by black pod disease and to vigour traits. Furthermore, comparisons with results from other studies are made and perspectives for the use of molecular markers in cocoa selection programmes discussed.
Material and methods
Plant material
Quantitative traits
Mapping analysis and QTL detection
RFLP and microsatellite markers allowed linkage groups to be identified with individual chromosomes in UPA 402 x UF 676 (Lanaud et at 1995). However the genetic map of Catongo x Pound 12, established by Crouzillat et at (1996), uses a different chromosome numbering system to that established by Lanaud et at (1995).
Exchanges of RFLP and microsatellite markers has allowed the correspondence between the two chromosome numbering systems to be established and this correspondence is shown in Table 3. In this present study, the UPA 402 x UF 676 map was used as consensus map for locating the QTL identified in the different parental genotypes.
QTL mapping was carried out using the Simple Interval Mapping (SIM) technique proposed by Lander and Botstein (1989). Composite Interval Mapping (CIM), developed by Zeng (1994), was applied only for QTL identified in the DR 1, 552, and MC 78 parents (Clement et a!. 2000). A LOD threshold value of 2 was generally applied to declare that a specific QTL was significant. In the study of Clement et all (2000) the LOD threshold values were fixed by the Churchill and Doerge method (1994).
Comparison of results
Phenotypic correlation
QTL related to yield, average weight of one pod and vigour traits
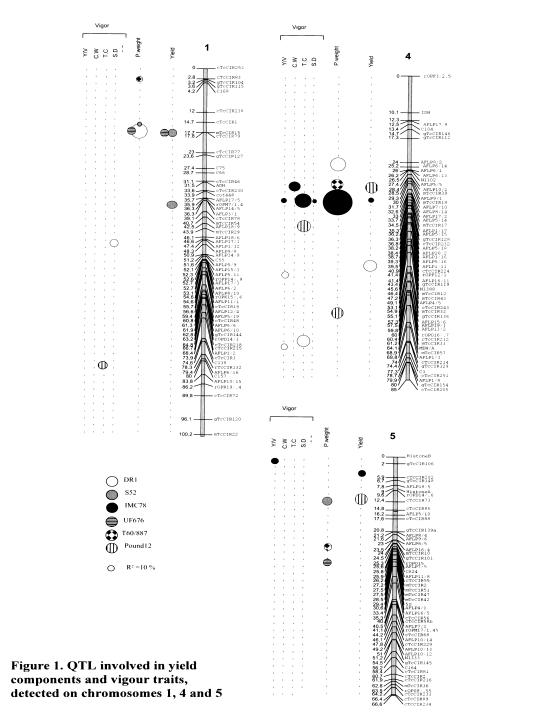
QTL related to the average weight of one pod have been identified in the same region as QTL for yield (Figure 1). In the case of chromosome 4, QTL related to the average weight of one pod were detected in the same region for T 80/887 and IMC 78. A QTL was detected close to this region in DR 1. The QTL located n IMC 78 explained 43.5% of the phenotypic variation; it might therefore involve a major gene (Clement et al. 2000).
On chromosome 4; several QTL for yield components and vigour traits were detected in the same region (Figure 1)
Discussion
Methods
QTL studies based on the analysis of several progenies sharing common parental genotypes require fewer individuals for each progeny. This method is interesting because it allows the stability of the QTL in different genetic backgrounds to be estimated. Simulation studies on poplar showed that better results could be expected using progenies with common parents (e.g. factorial mating designs) than using unrelated progenies (Muranty et at 1996).
Different chromosome numbering systems are currently being used in the two genetic maps of cocoa, It is suggested that the numbering system established for the UPA 402 x UF 676 progeny should be universally adopted (Risterucci et at 2000).
Microsatellite markers reveal a higher level of polymorphism than RFLP markers (Risterucci et al. 2000; Clement et a!. 2000). They also require less DNA and some of the analyses can be automated. The microsatellite technology appears to be currently the most appropriate method for genetic mapping and QTL analyses in cocoa. Indeed, microsatellite markers allow easy identification of the linkage groups and comparison of maps from different progenies. They have also been used in genetic diversity studies and to confirm the identity of clones and seedling progeny. Moreover, microsatellite marker technology will be easily transferable to laboratories in tropical countries (since the technique does not involve the use of radioactivity) and applied to Marked Assisted Selection (MAS).
The Simple Interval Mapping (SIM) technique proposed by Lander and Botstein (1989) has been the detection method generally used for the detection of OTL in cocoa. However, the Composite Interval Mapping (CIM) approach increases detection power and improves the estimation of the phenotypic variation explained by the QTL. With CIM analyses, 5 to 10 markers, given by the forward, and backward regression (co-factors added to the model), are generally used. This method is being increasingly applied in QTL mapping analyses.
QTL identified
For the Pound 12 and IMC 78 progenies, yield was observed over several years in Costa Rica and Côte d’Ivoire, respectively. The co-localised QTL for yield of these two Forasteros were the ones which were also the most stable in time. This co-location of QTLs between IMC 78 and POUND 12 could possibly also be due to the similar genetic origin of these genotypes. Indeed, according to Pound (1943), the genotypes collected on the Nanay river (as POUND 12) grew not far from the area where the IMC (Iquitos Mixed Calabacillo) trees were collected. Recent diversity studies on Upper Amazon Forastero genotypes showed that the genetic distance between Nanay (NA) and IMC clones was relatively low (Sounigo et at 2000). Therefore, a genetic linkage disequilibrium may have been maintained between markers and genes involved in yield components between IMC and NA genotypes.
The QTL for the average pod weight with the MC 78 parent was detected on chromosome 4 and explained 43.5% of the phenotypic variation. Close to it, a QTL related to the same trait was identified in DR 1 (R’=22). Studies on the genetic control of fruit traits (weight and size) have been carried out on other species such as tomato (Grandillo et at 1999; Ku et at 1999). An example is given by Ku eta!. (1999) on the genetic control of fruit length and the constriction at the stem end of the fruit. We can suggest a similar situation concerning genes involved in the genetic control of pod form (weight, shape) in cocoa especially for the QTL located in the common region of chromosome 4 of these two types. Research to establish a candidate gene for this yield component could be envisaged.
Perspectives
Molecular markers have opened a new era of more efficient selection for quantitative traits. In this study, QTLs involved in important traits for breeding were identified. The co-localisation of some of them in progenies from parents belonging to the either the same or different genetic groups confirms the stability of some of the QTL identified. This is a favourable situation to consider marker assisted selection (MAS).
MAS allows breeders to follow two main approaches. The first approach consists of monitoring the accumulation of favourable genes in one genotype in back-cross progenies (Marked Assisted Back-Cross). The second allows for better assessment of the genotypic value of individuals from the marker genotype, allowing for Marker Assisted Recurrent Selection (MARS). This second approach seems more appropriate for the use of molecular markers in cocoa breeding programmes. Various applications of MARS were recently developed by Gallais eta!. (2000).
The advantage of selection based only on markers is that the selection cycle can be considerably shortened. In order to use all sources of genetic variability from marked and unmarked QTLs it seems, however, better to use Marker Assisted Selection, combining molecular score and phenotypic value in an index, such as that defined by Lande and Thompson (1990).
References
CLement D., A.B. Eskes, 0. Sounigo and J.A.K. N’Goran. 1994. Amelioration genetique du cacaoyer en Cote d'lvoire. Presentation d'un nouveau schema de selection. Pages 451-455 in Proceedings of thelith International Cocoa Research Conference, July 18-24, 1993, Yamoussoukro, Ivory Coast. Cocoa Producer’s Alliance, Lagos, Nigeria.

Biotech Glossary |
Bioinformatics |
Lab Protocol |
Notes |
Malaysia University |
Analysis of QTL Studies Related to Yield and Vigour Traits Carried out With Different Cocoa Genotypes
Didier Clement’, Ange-Marie Risterucci and Claire Lanaud
1 - Cirad-Cp, TA 80/02, Avenue Agropolis, 34398 Montpel!ier Cedex 5, France
2 - Cirad-Amis, TA 40/03, Avenue Agropolis, 34398 Montpel!ier Cedex 5, France
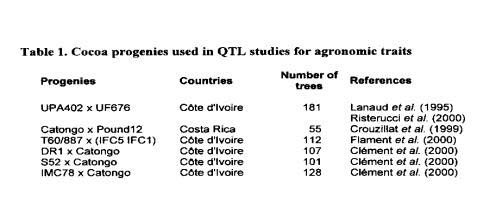
The progenies used for the QTL studies compared in this paper and the references of the publications related to these studies are presented in Table 1. Pound 12, MC 78, T 60/887, and UPA 402 are Upper Amazon Forastero genotypes. Pound 12 and MC 78 are genotypes collected by Pound (1938, 1943), UPA 402 is a result of sib-crossing between two genotypes of the 187 progeny (NA 34 x IMC 60), and 160/887 is a progeny of PA 7 x NA 32. UF 676, DR 1, and S 52 are Trinitario clones. IFC 1 and IFC 5 are Lower Amazon Forastero selections from Cote divoire; IFC 5 has probably received some introgression of genes from African Trinitario. Catongo is a highly homozygous Lower Amazon Forastero selected in the Bahia State in Brazil. The number of trees observed in each progeny varied between 55 and 181.

Yield and vigour data were obtained over several years during the juvenile production phase (first seven years of production), during the mature phase or during both phases (Table 2). The following traits were analysed in the different studies:
A total of 473 markers were used for the genetic mapping of UPA 402 x UF 676, currently the most saturated map of the cocoa genome. RFLP probes and microsatellites were used as co-dominant markers and AFLP and RAPD as dominant markers. Genetic maps built from progenies with heterozygous parents (double pseudo test cross) such as UPA 402 x UF 676, were made generally using Joinmap version 1.4 (Stam 1993). A genetic map of Catongo x Pound 12 (Crouzillat et at 1996) was established with MAPMAKER (Lander et at 1987). For all these maps, the Kosambi mapping function was used.
.jpg)
.jpg)
A strong significant correlation between yield and vigour for adult trees was found in the different studies (Table 4). This is to be expected since competition will have had its effect by the time the trees reach this adult stage. Except for the S 52 x Catongo progeny, the correlation between yield and vigour at a young age was not significant. In general, early vigour is more significantly correlated with the first years of production than with production in later years (Eskes et at 1995).
Table 4. (PAGE 130)
Genetic maps
For crosses with Catongo (highly homozygous), the markers reflect only the heterozygosity of the parents: Pound 12, DR i,S 52, and MC 78. This is also broadly the case with 160/887, IFC 1, and IFC 5 which are all fairly homozygous. For the UPA 402 x UF 676 map, the marker segregation mainly reflects the high level of heterozygosity of UF 676. The characteristics of each of the maps are shown in Table 5.
Table 5. (PAGE 130)
QTL detection
SIM and CIM analyses were carried out for QIL detection with DR 1, S 52, and IMC 76 (Clement et al 2000). In the other studies, QTL analyses were carried out using SIM only. The comparison of results obtained using SIM and CIM showed differences in power (LOD score of the peak) and efficiency (estimation of the R2). In some cases the percentage of the phenotypic variation explained by the QTL (R2 values) estimated in CIM analyses were higher than those obtained using SIM, but lower in others (Clement eta!. 2000).
The most significant OIL for yield, average weight of one pod and vigour traits were mainly detected on chromosomes 1, 4, and 5 in the different heterozygous parents.

The results are illustrated in Figure 1, based on the consensus map of UPA 402 x UF 676.
QTL related to yield were detected in the same region of chromosome 1 (around mTcCIR1 5) for two Trinitario genotypes (UF 676 and S 52). QTL related to yield for two Upper Amazon Forastero genotypes (POUND 12 and )MC 78) were also identified in the same regions, but of chromosomes 4 and 5.
Genetic mapping of yield, its components and other agronomic traits must be carried out using data gathered from field trials over several years. Most of the progenies analysed were planted in existing hybrid variety trials. This implies that, in most cases, the statistical analysis has been carried out using data from less than 100 trees. It is considered now that QTL analyses require observations on progenies with at least 200 individuals.
Genetic diversity stuthes on the Trinitario group have shown that this group resuited from hybridisation between almost homozygous Criollo and Forastero individuals (Motamayor eta!. 2000). In this situation, we can suppose that a linkage disequilibrium between molecular markers and agronomic traits may have been maintained. Indeed, common QTLs related to yield components have been found in different Trinitario clones (DR 1, S 52, and UF 676). This could mean that there is a good chance that the QTL identified in one Trinitario type will also apply to other Trinitario genotypes.
Clement D., AM. Risterucci, L. Grivet, J-C. Motarnayor, J.A.K. N’Goran and C. Lanaud. 2000 Cartographie genetique de caracteres lies au rendement, a Ia vigueur, a Ia résistance a P.palmivora et aux feves, chez Theobroma cacao. In press in Proceedings of the 13th International Cocoa Research Conference, October 9-14, Kota Kinabalu, Malaysia.
Churchill GA. and R.W. Doerge. 1994, Empirical threshold values for Quantitative Trait Mapping. Genetics 8: 963-971.
Crouzillat 0., E. Lerceteau, V. Petiard, J. Morena, H. Rodriguez, 0. Walker, W. Phillips, C. Ronning, R. Schnell, J. Osei and P. Fritz. 1996. Theobroma cacao L.: a genetic linkage map and quantitative trait loci analysis. Theor. AppI. Genet. 93: 205-214.
Crouzillat 0., B. Ménard, A. Mora, W. Phillips and V. Petiard. 2000, Quantitative trait analysis in Theobroma cacao L. using molecular markers, Euphytica 114: 13-23.
Eskes A.B., D. Paulin, D. Clement, J.A.K. N’Goran, 0. Sounigo, P. Lachenaud, C. Cilas, 0.Berry and A. Yagmpam. 995. Methodes cle selection et connaissances acquises en génétique par les programmes damGlioration du cacaoyer en Cole d’lvoire et au Cameroun.Pages 41-56 ici Proceedings of the International workshop on Cocoa Breeding Strategies.October 18-19, 1994, Kuala Lumpur, Malaysia. INGENIC, United Kingdom.
Flament M.H., L icebe, 0. Clement, L Pierretti, AM. Risterucci, J.A.K. N’Goran, C. Ciias, 0. Despreaux and C. Lanaud. 2000. Genetic mapping of resistance factors to Phytophthora palm) vora in cocoa, Génome. In press.
Gallais A.. A. Charcosset, I. Goidringer, F. Hospital and L. Moreau. 2000. Progress and prospects for marker-assisted selection. Quantitative Genetics and Breeding Methods. In Proceedings of the Xlth Meeting of the Section Biometrics in Plant Breeding, August 30-September01 2000, Paris, France. In press
Grandillo S., MM. Ku and S.D. Tanksley. 1999. Identifying the lad responsible for natural variation in fruit size and shape in tomato. Theor. AppI. Genet. 99: 978-987.
Ku H-M., S. Doganlar, KY. Chen and S.D. Tanksley.1999. The genetic basis of pear-shaped tomato fruit. Theor, AppI, Genet. 9: 844-850.
Lanaud C., AM. Risterucci, J.A.K. N’Goran, D. Clement, M. Flament, V. Laurent and M. Falque. 1995 A genetic linkage map of Theobroma cacao L. Theor. AppI. Genet. 91: 987-993.
Lanaud C., I. Kébe I, AM. Risterucci, 0. Clement, J.A.K, NGoran, L. Grivet, M, Tahi, C. Cilas, I. PiereW, AS. Eskes and 0. Despreaux. 1999. Mapping quantitative trait oci (OIL) ~r resistance to Phytophthora paknivoi’a in T. cacao L. Pages 99-1 05 in Proceedings of the 12th International Cocoa Research Conference, November 17-23, 1996, Salvador, Bahia, Brazil
LandeR, and R. Thompson. 1990. Efficiency of marker-assisted selection in the improvement of quantitative traits. Genetics 124: 74S-756.
Lander E., P. Green, J. Abrahamson, A. Barlow, M. Daly, S. Lincoln and L. Newburg. 1987, Mapmaker: an interactive computer package for constructing primary genetic linkage maps of experimental and natural populations, Genornics 1:174-181.
Lander ES. and 0. Botstein. 1989. Mapping mendelian factors underlying quantitative traits using RFLP linkage maps. Genetics 121:185-199.
Motamayor J.C., AM. Risterucci and C. Lanaud, 2000. Cacao domestication II: progenitor germplasni of most cultivated cacao until 1950. In press in Proceedings of the 131h International Cocoa Research Conference, October 9-14, Kota Kinabalu, Malaysia.
Muranty H. 1996. Power of tests for quantitative trait loci detection using full-sib families in different schemes. Heredity, 76:156-165.
Pound F.J, 1943. Cocoa and witches’ broom disease: report on a recent visit to the Amazon teffltory of Peru. The archives of cocoa research, volume I, (Toxopeus, K, ed), ACRI-IOCC, London, United Kingdom.
Risterucci AM.. L. Grivet, J.A.K. N’Go,an, I. Pieretti, M-H. Flament and C. Lanaud. 2000. A high-density linkage map of Theobroma cacao L. Theor. AppI. Genet. 101: 948-955.
Sounigo 0., V. Christopher, S. Ramdahin, ft Umaharan and A. Sankar. 2000. Evaluation and use of the genetic diversity present in the International Cocoa Genebank, Trinidad (ICG T). In Proceedings of the 3rd INGENIC International Workshop on the New Technologies and Cocoa Breeding, October 16-17, Kota Kinabalu, Sabah, Malaysia. In press.
Stam P. 1993, Construction of integrated genetic linkage maps by means by a new computer package: JoiriMap. The P’ant Journal 3:739-744.
Zeng Z.B. 1994. Precision mapping of quantitative trait loci. Genetics 136: 1457-1468.