1 - Centro de Pesquisas do Cacau (SEGEN/CEPEC/CEPLAC), Ilhéus, BA, BraziI~ 45.660-000
Phenotypic data analysis from CEPEC’s germplasm collection indicated a strong association between individual bean weight and total bean weight per pod, between number of pods and total bean weight per tree and between witches’ broom resistance in cushion, canopy, pods and resistance to black pod. In a factor analysis, these constituted three factors which explain 80% of the total variation of 13 traits. The analysis of variance of the factorial scores (therefore relative to the set of traits that each factor emphasises) and the cluster analysis based on the original data indicated the existence of two main groups. The first group included domesticated materials, Trinitarios, Criollos and Lower Amazon genotypes; genotypes in this group were characterised by a high yield and large pods and beans. The second group included wild Amazon genotypes, characterised by a high resistance to black pod and witches’ broom disease and high fat content. Inter-mating individuals of these two groups, for the production of superior varieties, is a logical option. On the other hand, the concentration of favourable alleles for specific traits, including pyramiding of genes for durable resistance to witches’ broom disease, requires simultaneous inter-crossing within groups. However, the groups mentioned are not totally distinct, as shown by RAPD analysis of 270 accessions of the CEPEC’s germplasm collection (genetic distance between these genotypes and reference genotypes are presented). Although there was a clear tendency for grouping of Lower Amazon accessions, of Trinitario and Criollo accessions and of Upper Amazon accessions, these groups are not clearly separated on the MOS plot with overlaps occurring between groups. This shows clearly the need for information from molecular markers for the formation of base populations or intercrossing groups. Another point that should be mentioned is the wide variation within Upper Amazon genotypes, particularly those from Peru, indicating that breeding programmes based only on genotypes of this group can successfully exploit the heterosis expected from crossing genetically distant genotypes (materials from Brazil are also widely variable). Analysis of genetic divergence, using RAPD markers also indicated the possibility that several different genes may contribute to resistance to witches’ broom disease, since there were large distances between genotypes with low disease severity in the canopy and cushions (i.e. less than 20% of infection in the germplasm collection. Molecular markers can also be important when phenotypic evaluations are not efficient in the identification of genotypes having resistance genes from both parents. Therefore, studies of marker-gene association, for each source of resistance, are essential and this will build the basis for a marker assisted recurrent selection.
Introduction
Two strategies are traditionally used in cocoa breeding programmes:
In both strategies, the breeding programmes have been limited to very few cycles of selection, frequently a single one based on a very narrow genetic base. This appears due to the following reasons:
The heterozygosity of the plants in the hybrid progenies, making these plants less useful as parents for second cycle hybrids.
The ‘first-cycle’ progenies were deployed as commercial hybrid varieties or used to select new clones. However, emphasis on crosses between clones selected in germplasm collections and continuously repeating the first cycle of selection, seems to have reached an end. In the Ivory Coast, Malaysia and Brazil, recurrent selection programmes have been proposed or initiated (Clement S a!. 1993; Lockwood and Pang 1993; Pires et a!. 1999a). Now, such programmes can be conducted more successfully through a better understanding of the distribution of economically important traits in the species, their interrelationships and, in particular, the availability and distribution of the genetic diversity present.
Material and methods
Traits considered
The variable Fat is an average of three samples obtained in one season; Phy is an average of five plants over a five year period; WBPL, PPL, and TPPL, are averages of five plants in three years; WB, DBP and WBP are averages of 15 samples in three years (of 40 beans each); DBPL is an average of five plants in three years, converted from WBPL through the dry/wet ratio obtained from the samples, and VB, CD, PB the average of 10 plants in four years.
Besides the phenotypic variables, data from 32 RAPO primers (127 polymorphic bands) extracted from Marita (1998) and involving 254 clones were used in the analyses. The 32 polymorphic primers, all from the Operon kit, were chosen based on results from previous studies of diversity and linkage maps (Marita eta!. 2000).
Analysis
Results and discussion
Factor and cluster analysis of phenotypic traits
Path-coefficient analysis, with the wet bean weight per plant as the main variable, and the number of pods per plant and the average weight of beans per pod as auxiliary variables, showed a high total correlation and a high direct effect of the number of pods per plant, suggesting also the importance of this trait in the selection for high yield. However, the variable bean weight per pod, which had low linear correlation with yield (r = 0.19), cannot be discarded since it has quite a high direct effect on yield (r=0.41).
Factor 3, which can be called the “resistance factor~’, indicates an association among the number of pods lost from black pod and from witches’ broom diseases and the number of vegetative and cushion brooms, indicating that indirect genetic gain is possible with early selection based on the number of vegetative brooms. The data used here came from the germplasm collection, and therefore, the relationships observed between traits can be related more to evolutionary differences (according to the origin of the genotypes) than to linkage or pleiotropism.
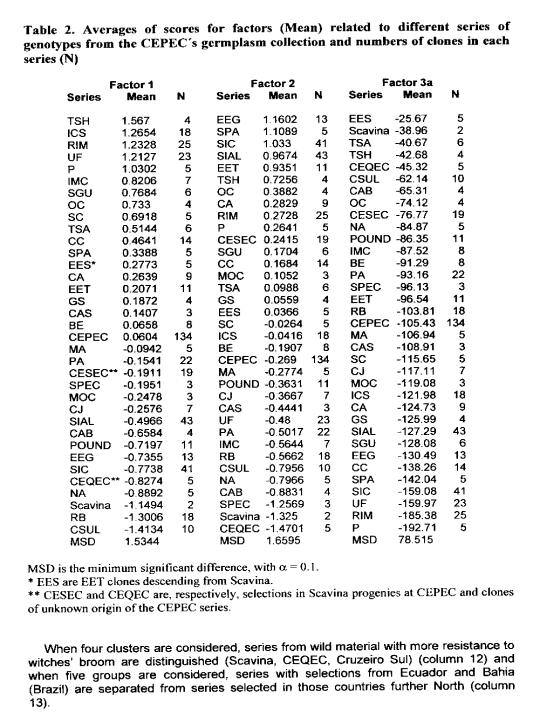
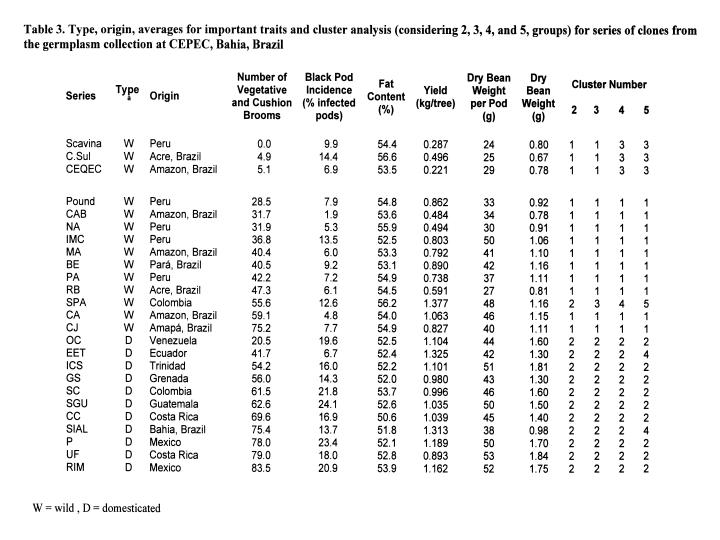
Analysis of the performance of several of the most important series of accessions conserved in the collection in relation to the factorial scores obtained and, therefore, for the group of traits that each factor emphasises, resulted in significant differences among these series for all factors (Table 2). Factor I emphasises series originating from the Caribbean region, Venezuela, Colombia and Central America, predominantly Trinitario and Criollo types selected from domesticated material (ICS, RIM, UF, P, SGU, CC, 00, and SC), and some series involving Amazon x Trinitario hybrids (TSH, TSA, EES, with EES here meaning EET clones descending from Scavina). In this series alleles for high bean and pod weight should be sought.
Factor 2, also emphasises series resulting from hybridisation and from selections made in plantations. Included in this case are the Lower Amazon clones selected from plantations in Brazil (SIC, SIAL, and EEG), a series resulting from selections in Ecuador (EET), selections in Scavina progenies at CEPEC (called here CESEC), and the SPA series that results from one cycle of selection from wild material.
Among those series with high values for factor 3 are Scavina hybrids (TSH, TSA, EES, CESEC) and Amazon types. An alternative factor 3 (referred to as factor 3A) is obtained directly by weighting the sum of the standardised variables by the factor loading with values larger than 0.4. Factor 3A eliminates the pressure put on bean yield by factor 3 and indicates more clearly the predominance of resistance genes among wild Forasteros including Scavina, CEQEC (six clones of unknown origin of the CEPEC series), CSUL (Cruzeiro do Sul), CAB, Na, Pound, IMC, Be, Pa, SPEC, and RB.
In Table 3, averages of important traits are presented for some series of accessions collected in the centre of diversity or selected in local varieties from different countries (as indicated in column 2). Each series is represented by 4 to 45 clones (Scavina includes only two clones because of its importance as a source of resistance to witches’ broom) with obvious limitations in representation of some groups. Considerations were made for the groups of series representing more appropriately the domesticated and wild types by the group of series forming.
Cluster analysis, using averages for the most important traits, separates the series of clones listed in Table 3 into two groups. The first group includes all series of wild materials, except SPA. The second group includes all series with domesticated material (column 10). It should be pointed out that the accessions of the SPA series are selections made in a stand from seeds collected in the wild and went through one cycle of selection. When three clusters are considered, the SPA series forms a separate group besides the two groups containing series with domesticated and wild accessions (column 11).
Among the 13 series with lower witches’ broom infection averages, only two are of the domesticated type. Apparently! genotypes more exposed to the disease are less affected than those that evolved in the absence of the disease. One could argue that during germplasm collection expeditions! preference was given to resistant plants. However, the efficiency of this selection is not high because of the relative low inoculum pressure in the wild. Similarly, for black pod disease among the 12 series with smaller frequency of pod losses, only one series includes domesticated material. It should be pointed out that black pod is not a disease specific to the genus Theobroma, and it is not a problem in wild populations. Itis expected that the selection pressure was larger in domesticated populations. A possible explanation for such results would be the evolution and adaptation of the pathogen to these varieties. The high uniformity in these varieties and the loss of resistance alleles by genetic drift could be alternative explanations for the high infection averages. With respect to uniformity, it can be reported that the series RIM (domesticated) with 19 clones and RB (wild) with 17 clones had pod losses between 10.3 and 35.7% and between 2.3 and 10.4%, respectively. Therefore, the reason for the low infection is not the high variability in the series RB. Practically all RBs had losses smaller than the RIMs suggesting the occurrence of resistance genes in the wild but not in the domesticated material.
The ten highest values for fat content were observed in wild materials and, in this case, there was no direct selection in any of the groups (domesticated vs wild). A possible reason for this result is the negative correlation between this trait and yield (Pires et al. 1998), such that the selection of high yielding materials could have reduced the fat content.
As expected, the domesticated materials showed the larger means for single bean weight, bean weight per pod, and yield. In short, there are two distinct groups. One group involves domesticated materials (Trinitario, Criollo or Lower Amazon clones) with high production and large bean and pod sizes. Another group involves wild Amazon material with high resistance and high fat content. Therefore, hybridisation between these groups is the obvious option for the development of superior cocoa varieties. Furthermore, resistance can be combined with good pod characteristics in one generation, exploiting heterosis for yield (e.g., crossing Scavina 6 with CS 1), However, the progeny of genetically very distinct parents will be highly heterozygous, making the selection of new parents for the next cycles of recurrent selection more difficult (if the interest is in hybrid varieties propagated by seeds). Crosses do not always result in gains for important traits (e.g. resistance in the Scavina 6 x CS 1 progeny is not higher than in Scavina 6 and the bean weight is not as high as in ICS1). For the Brazilian programme, it is critical to accumulate genes for resistance to witches’ broom in order to get durable resistance; therefore, it is necessary, also, to make crosses within groups.
Genetic diversity revealed by molecular markers
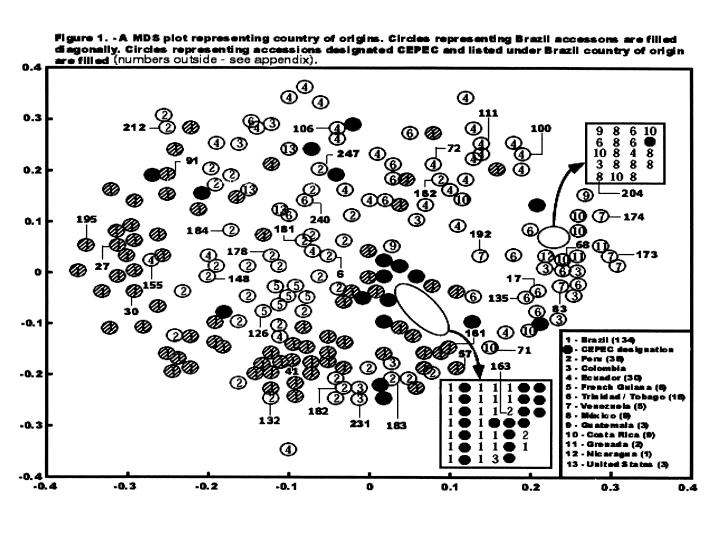
An important point is that the geographic groups are not completely distinct, as shown in Figure 1. Although there is a clear tendency for grouping of the Lower Amazon types at the base of the MDS plot, Trinitarios and Criollos to the right, Upper Amazon types to the left and at the base, and hybrids according to their ascendance, there is overlap between groups. Therefore, if molecular marker information is ignored, making crosses between an Upper Amazon with a Lower Amazon, or between two Upper Amazons, could in fact include genotypes that are either genetically very distant or very close. The result would not be definitive. This clearly illustrates the importance of applying molecular markers to create base populations or inter-crossing groups.
In previous studies, the genetic groups were defined with less overlap between the groups, but these studies involved smaller sample sizes and included fewer genotypes from the Brazilian Amazon (N~Goran et a!. 1994; Figueira at at 1994; Laurent ot al. 1994). Brazilian materials are very diverse, even if the CEPEC series that involve mainly hybrids are excluded (Figure 1). Genotypes from Ecuador are also diverse, in part because they include hybrids (throughout the top centre of the MDS plot) and some Amazon genotypes (on the left side). However, derivatives from the Nacional variety from Ecuador are close to each other on the top right. Another very diverse group is that from Peru (middle-left side from the top to the base).
The large spread of the Upper Amazons indicates that breeding programmes based purely on materials from that region can exploit the possibility of heterosis and the variability within this group. Scavina 6 and 12 (the two genotypes from Peru positioned on the top left of Figure 1) are very distinct genetically from nearly all other genotypes. This may be one of the reasons why Scavinas are good parental types, as is the case in crosses with some Trinitarios (ICSs) or Lower Amazons (e.g., SICs and SIALs). Crosses between local materials from Bahia (SIC, SIAL, EEG) with Trinitarios, not so genetically distant, also give rise to good performance. However, in this case the genotypes involved are good clones, and here it is possible that the additive effects are more important than in the case of Scavina. Finally, the position of genotypes from the Nacional variety from Ecuador (top right in Figure 1) indicates the possibility of exploiting heterosis in crosses involving these and Upper or Lower Amazon genotypes.
Use of genetic diversity in breeding for resistance to witches’ broom
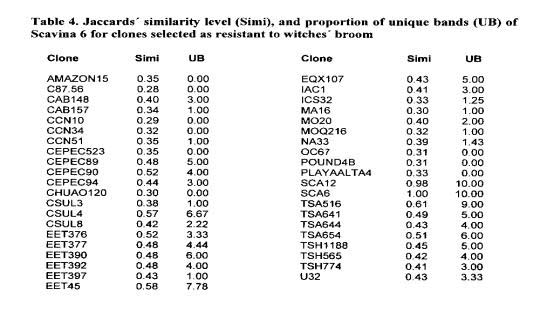
Among the clones selected with a less than 20% infection leveL 43 have been cited as not related to Scavina and several of them are geneticalJy very distinct (Table 4; note that not all clones were included in the marker analyses). While more uniform series showed averages of similarities larger than 65% (SIC and SIAL with 78%, GU with 84% and CS with 67%), very low values were observed between Scavina 6 and other genotypes selected as resistant including Upper Amazon genotypes: Cruzeiro do Sul (C.Sul), Pound, Ucayali (U), Amazon, Nanay (NA), Morona (MO), and MOQ). Scavina 6 progeny derived from crosses with very distinct genotypes also show a relatively low level of similarity with Scavina 6 (genotypes TSA, TSH, IAC, EET). These are identified by the typical distribution of the hybrids (see Figure 1 in Marita et a!. 2000).
Molecular data reveal 10 bands unique to Scavina 6 (present only in 8 to 15% out of the 292 genotypes analysed). Table 4 lists the proportion of these 10 unique bands present in other clones selected for resistance to witches’ broom. Considering the proportion of unique bands from Scavina and the similarity information for all genotypes, different groupings can be observed. The first group includes hybrid genotypes (TSA, TSH, EET, lAG) with low similarity to Scavina and located in a position in the MDS plot intermediate to their respective genetic lineage (Marita et at 2000).
This group has a high proportion of unique bands from Scavina showing their descent from this clone. Another group is formed by the Upper Amazon clones, which are evolutionarily closer to Scavina and show a higher number of Scavina’s unique bands, However, such a high frequency of Scavina’s unique bands does not necessarily indicate they have the same resistance genes as Scavina. Another group includes clones with unclear origin or genealogy. The CCN clones, particularly CCN-10 and CCN-34, show no unique bands from Scavina. Therefore, these hybrid clones have not have descended from Scavina. This group also includes the CEPEC-523 clone that did not show any of the Scavina’s unique bands.
The genotypes CEPEC 89, 90 and 94 also have unknown origins. These clones come from pods confiscated by the Sanitation Protection Service. They are situated in positions intermediate between Upper Amazon and Trinitarios (Marita et at 2000). Since they have a high frequency of Scavinas unique bands, they most likely are descendants of these clones.
An interesting case is the clone EET 45, supposedly a Nacional type from Ecuador and with a position on the MDS plot that agrees with this (Marita et a! 2000). This clone has 7 out of the 9 unique bands from Scavina (one of the 10 markers was not considered, because the result was doubiful) and is cross-incompatible with Scavina. This confirms its mislabelling in the collection. EQX-107 has a similar number of unique bands, similar position on the MDS plot and similar sexual incompatibility, and it is probably another misidentified descendant of Scavina.
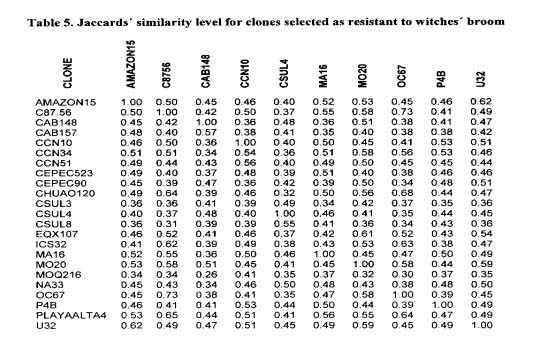
The similarity matrix shows a wide distance among many genotypes selected as resistant to witches’ broom (summarised in Table 5). Exceptions include genotypes from Venezuela and Trinidad, which are genetically more similar (C87.56, CS 32, Chuao 120, Playa Alta 4). CS 32, not included in Figure 1, and CS 95 were the only ICS clones among the 12 studied, that exhibit the unique bands of Scavina (1 and 3 marks, out of 8 and 9, respectively). Six clones of the GU series included in the marker studies did not show any of the unique SCA 6 bands. Two GU clones were selected as resistant (t31J 114 and 222), but were not included in the marker studies,
Molecular markers offer advantages to cocoa breeders by identifying the range of genetic diversity present in their base populations. The large number of genotypes selected specifically for resistance to witches’ broom represent a wide range of genetic diversity. This information allowed base populations to be established for pyrarniding resistance genes and associating resistance with other traits of agronomic importance as proposed by Pires et al. (1999a).
Molecular markers can also be important when phenotypic evaluations are not efficient in the identification of genotypes having resistance genes from both parents. For example, Scavina 6 is very resistant to witches’ broom in Bahia and this resistance is dominant. Adding new alleles of resistance may not increase this resistance. As a result, individuals accumulating alleles from both parents cannot be distinguished from those receiving favourable alleles only from Scavina. Under these conditions, pyramiding genes of resistance without the use of molecular markers can be a very difficult or impossible task. Studies of marker-gene association for each source of resistance are then essential and form the basis for a marker assisted recurrent selection.
References
Clement D., A.B. Eskes, 0. Sounigo and J.A.K. N’Goran. 1993. Amelioration genetique d
cacaoyer en Cote d’ivoire: presentation dun nouveau schema de selection. Pages 451-456 in Proceedings of the 11th International Cocoa Research Conference.1993, Yamoussoukro, Cete d’lvoire. Cocoa Producers’ Alliance, London, U.K.
![]()
Biotech Glossary |
Bioinformatics |
Lab Protocol |
Notes |
Malaysia University |
Diversity for Phenotypic Traits and Molecular Markers in CEPECs Germplasm Collection in Bahia, Brazil
José Luis Pires1, Jane M. Mania2, Uilson Vanderlei Lopes’, Milton MaccM Yamada’, W. Martin Aitken3, Gilson P. Mdc’, Wilson Reis Monleiro’ and Dario Abnert
2 - Dept of Forestry — University of Wisconsin, Madison, 53706
3 - Almirante Centro de Estudos do Cacau, Itajuipe, BA, Brazil, 45630-000
4 - Universidade Estadual de Santa Cruz, Jihéus, BA, Brazil, 45.660-000
1. selection of clones and
2. selection of hybrids (full-sib progeny between heterozygous parents, usually of diverse type or origin).
Factor analysis was used to describe the relationship among all of the variables. This method summarises the information contained in a large number of measured variables in fewer non-observable variables, called factors. The measured variables depend on these latent variables and random errors. Factor analysis tries to identify variables that can be grouped based on their correlations, keeping a high correlation within group and a low correlation between variables of the other groups (Johnson and Wichen 1999; Mardia et at 1997). Principal components were used as method of estimation. The factorial rotation was done by the Varimax method and the determination of the factorial scores by the regression method (SAS Institute 1990). In addition, the variances between averages of scores of important series, for different factors, were analysed to identify those with greater performance for the group of characteristics that each factor emphasises. A complementary cluster analysis was done on the averages of the variables, for different series of genotypes, using PROC CLUSTER, with the Centroid model option (SAS Institute 1990).
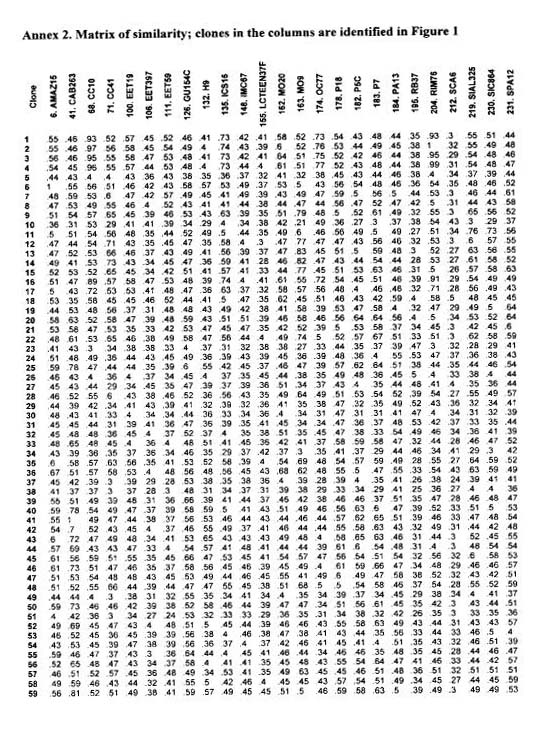
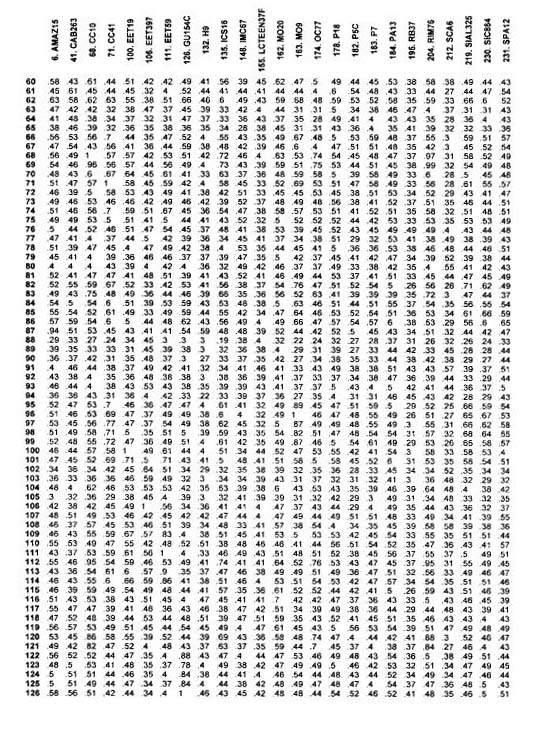
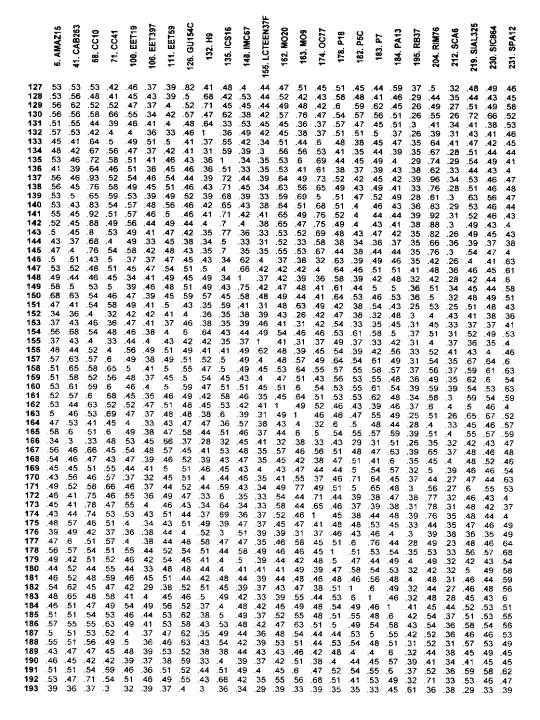
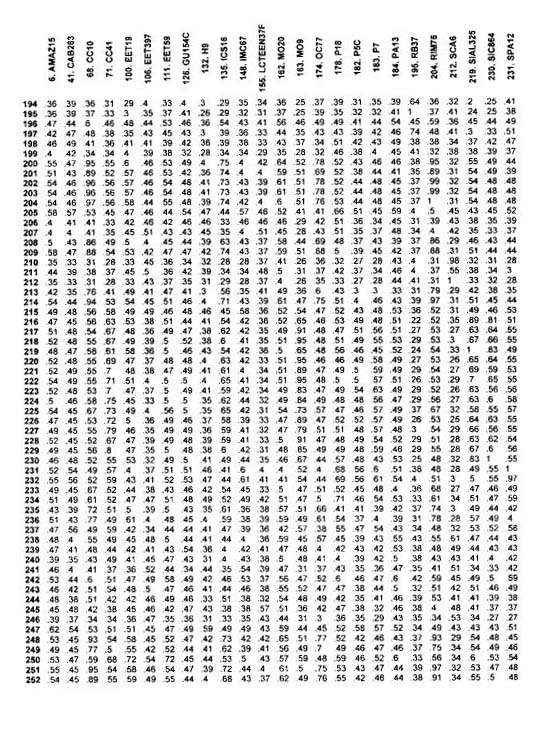
A similarity matrix containing 252 genotypes was obtained using Jaccards’ model for the RAPD markers. In order to simplify the visualisation of the relationships among the genotypes, a matrix of genetic distances, obtained from the complement of simple matching coefficient (Gower 1985) and converted in structures of bi-dimensional coordinates of the MDS plot (SAS Institute 1990), was used as presented by Marita (1998).
In the factor analysis, three factors explained 79.8% of the total variation. The commonalities, which indicate the proportion of the total variance of each variable explained by the group of common factors, were 42.1% for pod loss by black pod, 60.4% for the number of vegetative brooms, 54.4% for the number of cushion brooms, 57.2% for pod loss by witches’ broom, and greater than 80% for the other traits.
After rotation, factor 1 clearly distinguishes, with large factor loadings, variables related to bean and pod weights. Therefore, factor 1 can be characterised as a ‘factor of bean and pod weights”. Since there is a high association between the weight of a single bean and the weight of all beans in a pod, the genetic improvement of both traits simultaneously is simplified (Table 1).
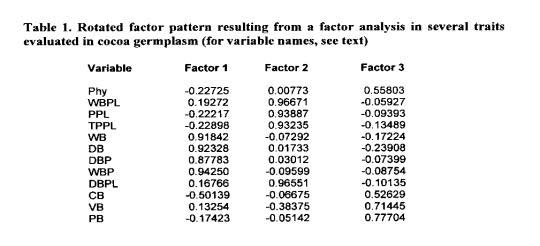
Factor 2 separates, with factor loadings larger than 0.9, the following traits: wet and dry bean weight per plant, number of healthy pods per plant and total number of pods (healthy and lost by any cause). Therefore, factor 2 can be defined as a “production factor”. It can be inferred that cocoa yield is more related to the number of pods per plant than to the average weight of each pod, and therefore, larger indirect genetic gains can be obtained by selection for the first trait.
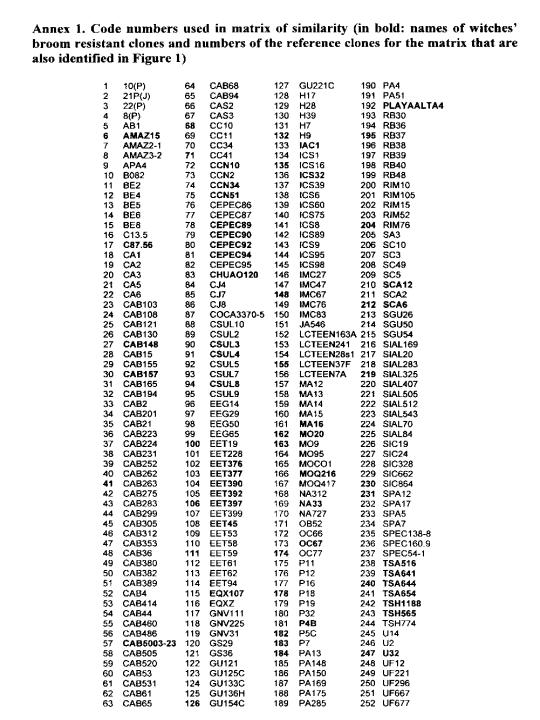
The analysis of the diversity in the CEPEC collection, based on 133 polymorphic RAPD markers for 270 accessions of the germplasm collection, is shown in Figure 1 (extracted from Marita 1998; see also Figure 1 in Marita at a!. 2000, in which all genotypes are represented). A similarity matrix is presented between 252 genotypes and 25 ‘reference’ clones well distributed and also present in other genetic diversity studies (see other papers presented at this Workshop).
An important point that shows up from this study of genetic diversity is the possibility of accumulation of genes for resistance to witches’ broom (previous studies suggest the disease is not controlled by a few genes, see Pires et al. 1999). This is illustrated in the similarity matrix among 252 genotypes (Annex 2) and in Tables 4 and 5. There, some accessions (bold lettering in the Annex 1) among the 55 that exhibited an infection level less than 20% of the overall average of the collection are presented (600 accessions were evaluated from 1995 to 1999 with 178 included in the diversity study). Also presented are five clones (Amazon 15, CAB 148, CAB 157, MO 20, and U 32) involved in the marker studies and among the 18 clones selected for witches broom resistance from the 127 new plant introductions in the germplasm collection. These clones were selected as described above, but involved only three evatuations.
Figueira A., J. Janick, M. Levy and P. Goldsborough. 1994. Re-examining the classification of Theobroma cacao L. using molecular markers. J. Amer. Soc. Hart. Sci. 119: 1073-1082.
Gower J. C. 1985. Measures of similarity, dissimilarity, and distance. Pages 297-405 in Encyclopaedia of statistical sciences 5 (Kots, S. and Johnson N.L., eds). Wiley, New York,
U.S.A.
Laurent V., AM. Risterucci and C. Lanaud. 1994. Genetic diversity in cocoa revealed by cONA probes. Theor. Appi. Genet. 88:193-198.
Lockwood G. and J.T.Y. Pang. 1993. Additive inheritance of yield in cocoa. Pages 415-423 in Proceedings of the 11th International Cocoa Research Conference, 1993. Cocoa Producers Alliance, London, U.K.
Johnson R. A. and D.W. Wichern. 1999. Applied Multivariate Statistical Analysis. Prentice Hall, New Jersey, U.S.A. 816pp.
Mardia K. V., J.T. Kent and J.M. Bibby. 1997. Multivariate Analysis. Academic Press Inc., San Diego, U.S.A. SlSpp.
Marita J.M. 1998. characterization of Theoboma cacao using RAPD-marker based estimates of genetic distance and recommendations for a core collection to maximise genetic diversity. MSc. Thesis. University of Wisconsin, USA.
Marita J. M., J. Nienhuis, J.L. Pires, and W.M. Aitken. 2000. Characterization of genetic diversity in Theobroma cacao in relation to witches’ broom disease. Crop Science. In press.
N’Goran J. A. K., V. Laurent, AM. Risterucci and C. Lanaud. 1994. Comparative genetic diversity studies of Theobroma cacao L. using RFLP and RAPO markers. Heredity 73: 569-
597.
Pires J.L., W.R. Monteiro, L.R.M. Pinto and E.D.M.N. Luz. 1999. Resistance to witches’ broom-
Evaluation of genotypes from different origins. Pages 389-397 in Proceedings of the 12th
International Cocoa Research Conference, Salvador, Brazil, 1996. Cocoa ProducerAs
Alliance, London, U.K.
Pires J. L., W.R. Monteiro, L.R.M. Pinto, MM. Yamada and D. Anhert. 1999a. A proposal for cocoa breeding. Pages 287-292 in Proceedings of the 12th International Cocoa Research Conference, Saivador, Brazil, 1996. Cocoa Producers Alkance, London, U.K.
SAS Institute. 1990. SAS/STAT User’s Guide. Version 6. Fourth edition. SAS Institute Inc., North Carolina, U.S.A.